LifeFlow.
A habit tracker that auto-fills your numbers, then asks you the question that's actually worth answering: how did today feel?
The value of a diary
is the reflection - not the data entry.
Most habit-tracking apps fall into one of two traps. They turn self-improvement into a video game with badges and streaks, or they turn it into manual data entry that feels like filing taxes. Neither one helps you actually understand yourself. LifeFlow takes the opposite stance: automate the numbers, protect the privacy, and put the cognitive effort where it earns its keep - on the reflection.
Why do people quit journaling apps?
To find out, I surveyed 17 people - students, busy professionals, and a handful of long-term journalers who had given up. The frustrations clustered into a clear pattern.
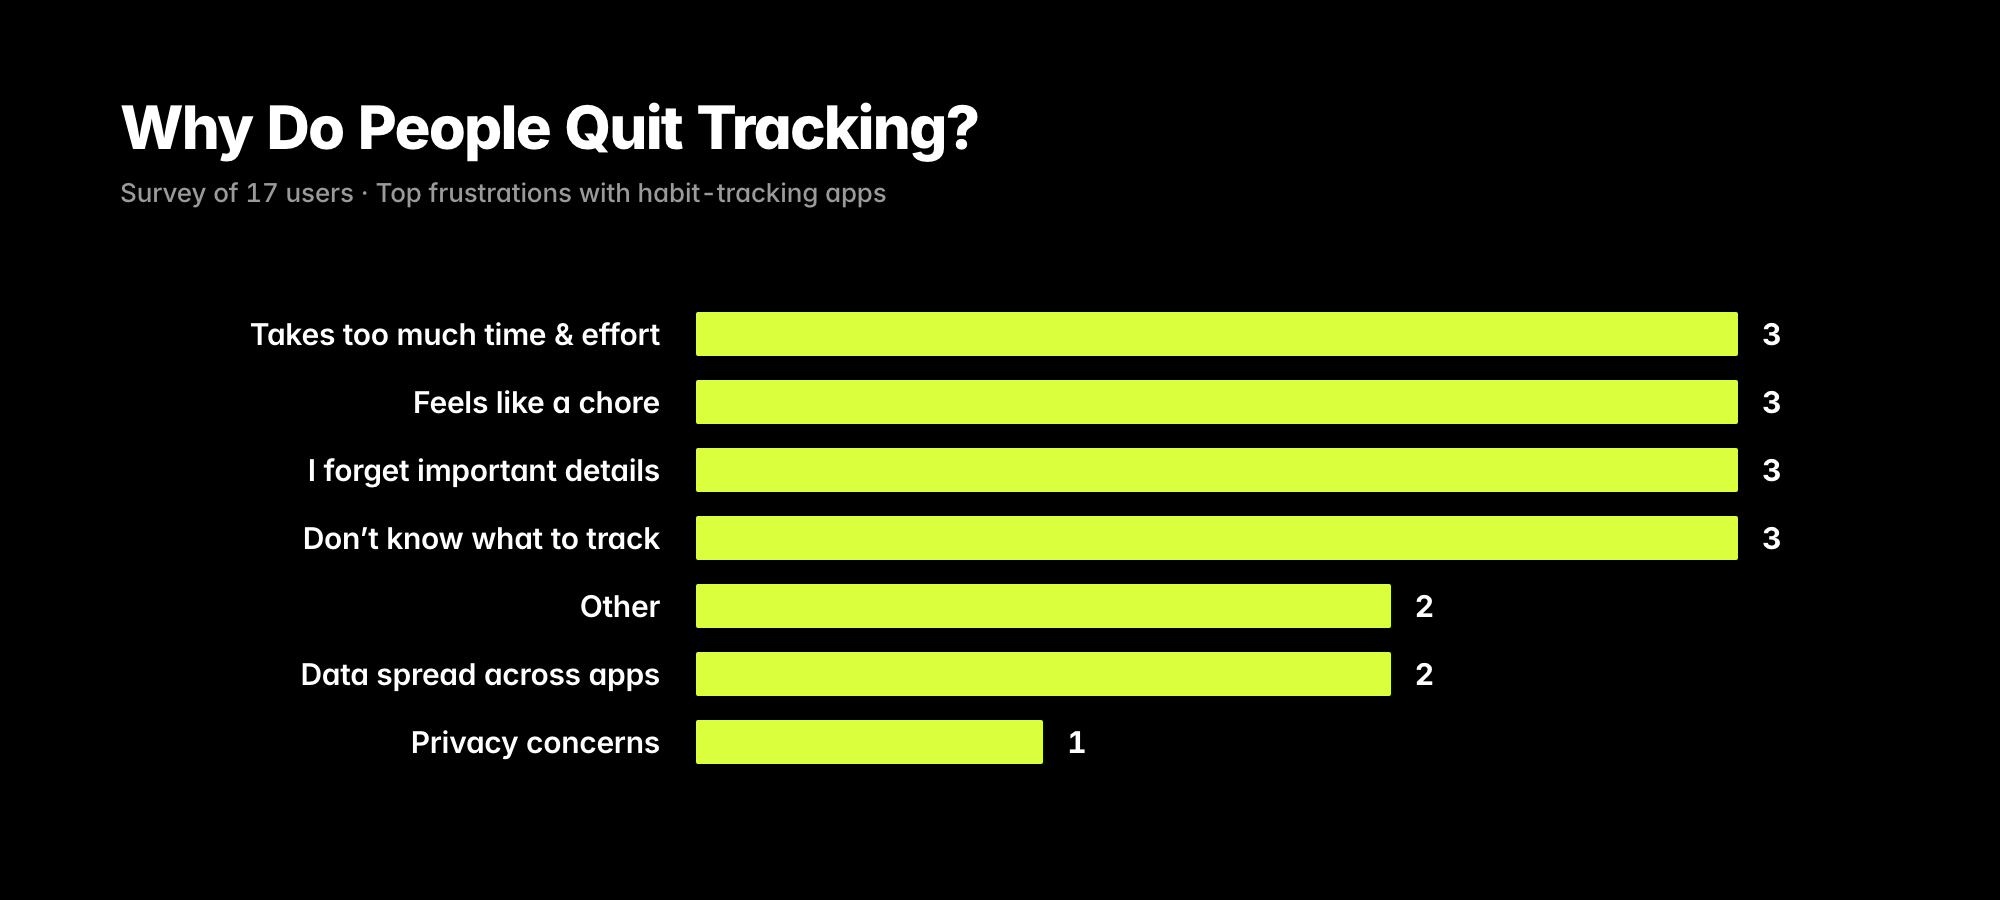
The data shows two themes. First, cognitive load: logging takes effort, feels like a chore, is easy to forget, and asks users to decide what to track in the first place. Second, disconnection: the numbers live in Apple Health, tasks live in Calendar, mood lives nowhere - and no single surface stitches them together.
Privacy showed up too, but only once as a quit reason. The interesting finding came later: when users described their ideal alternative, privacy moved from background concern to non-negotiable precondition. That distinction - quit-driver vs. structural requirement - shaped two different parts of the design.
Four findings that shaped every decision after.
Before opening Figma, I went through every survey response and pulled out the patterns. Four findings did most of the work - each one closed off a design direction and locked in another.
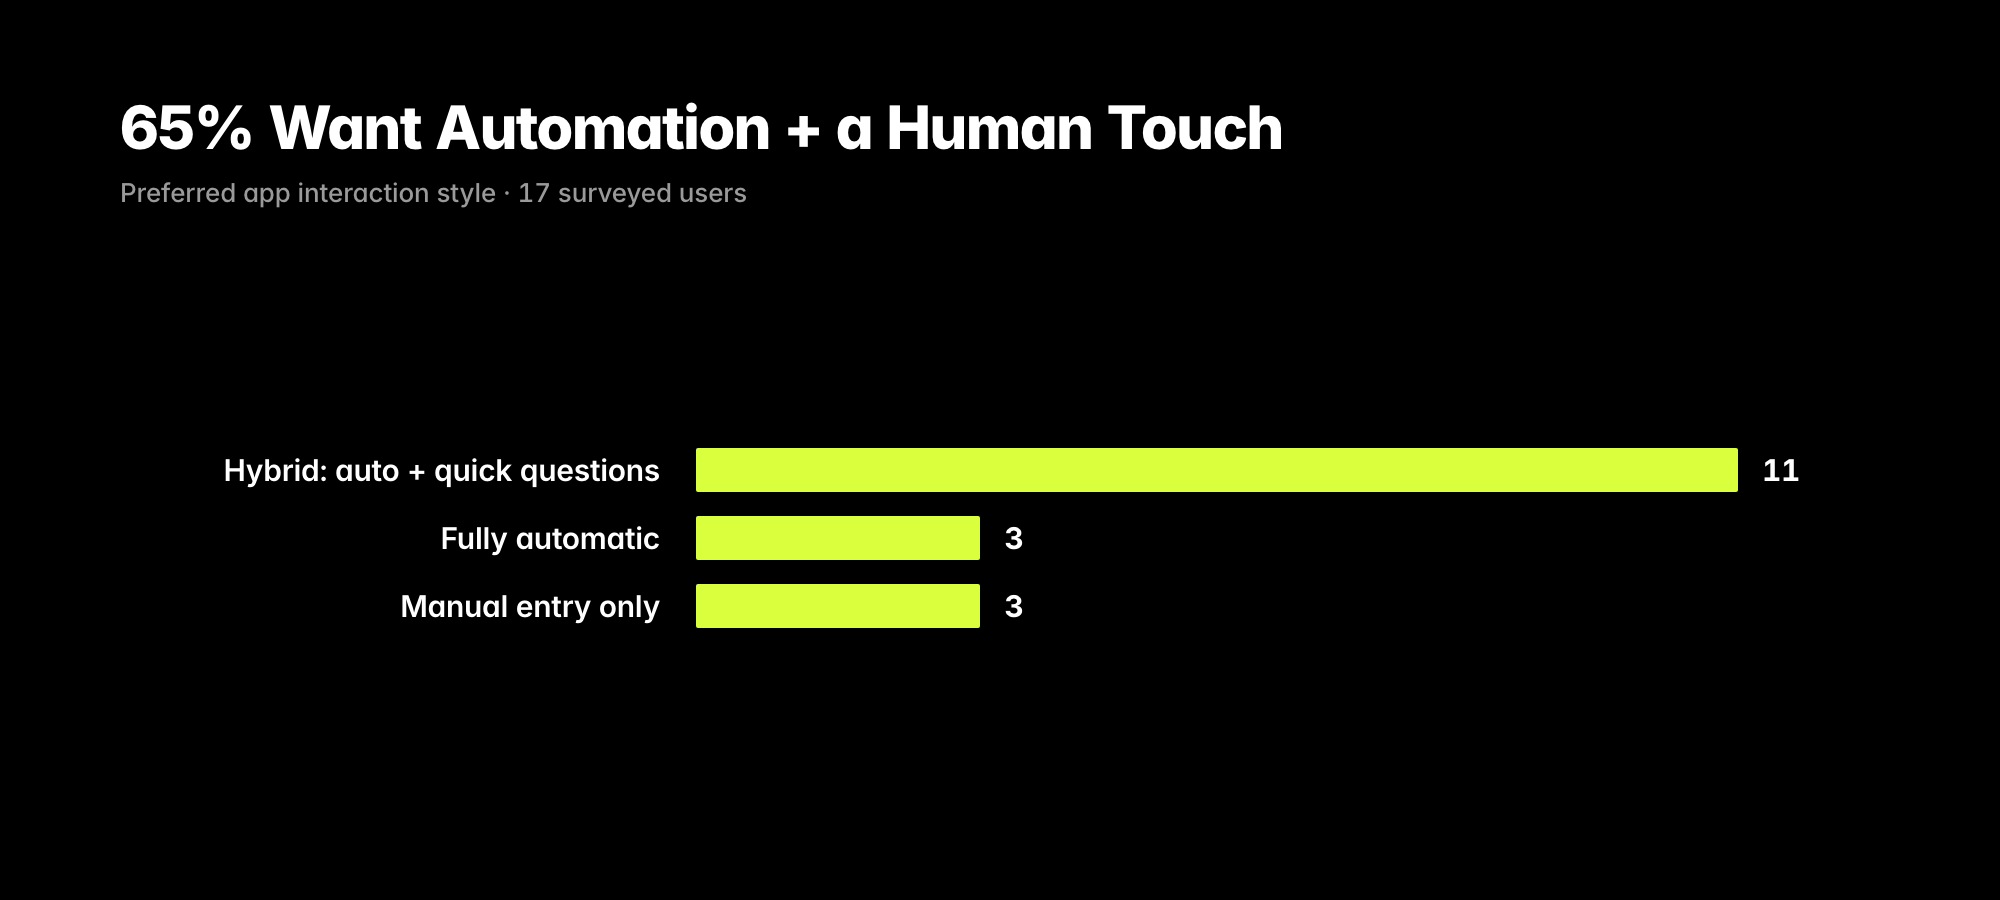
Wanted automation with a quick personal check-in
Not fully manual, not fully robotic. 11 of 17 respondents preferred a hybrid model - auto-track the numbers, ask a few short questions in the evening. This became LifeFlow's core interaction model.
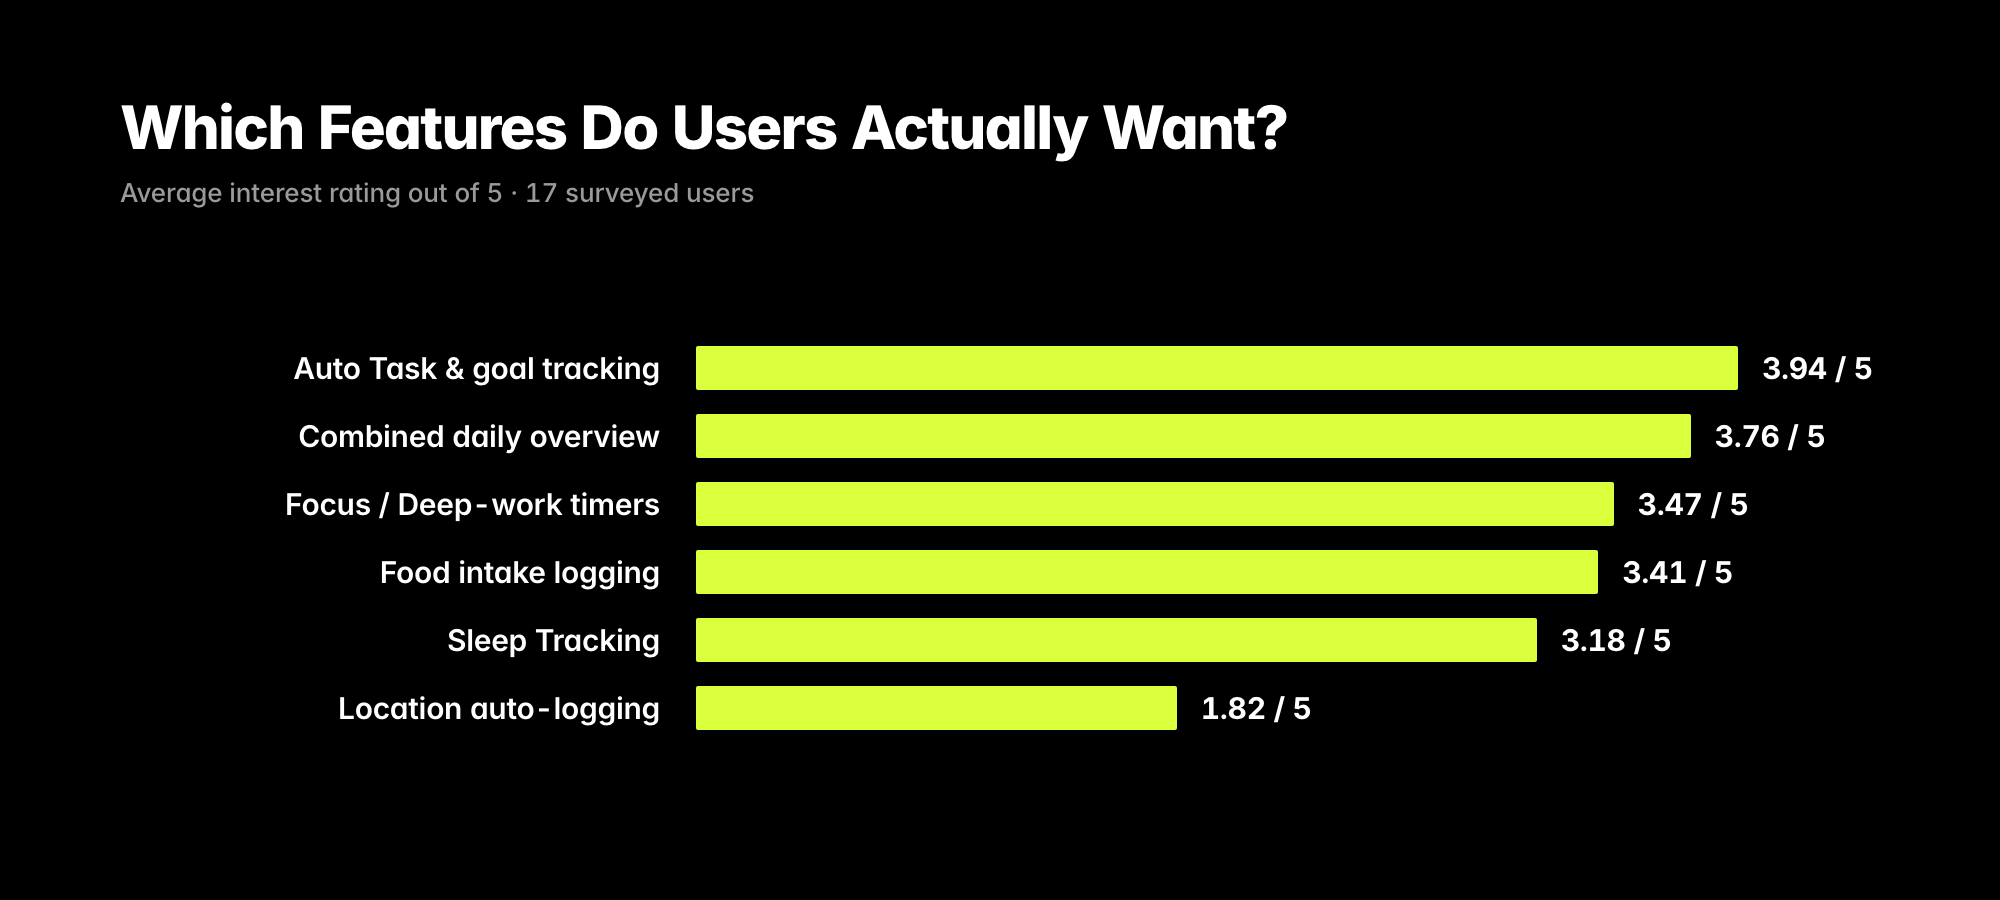
Location logging ranked dead last
Auto task and goal tracking topped the list at 3.94/5. The combined daily overview followed at 3.76/5. Location logging scored just 1.82/5 - so I cut it from V1 entirely. Doing fewer things well beats doing more things passably.
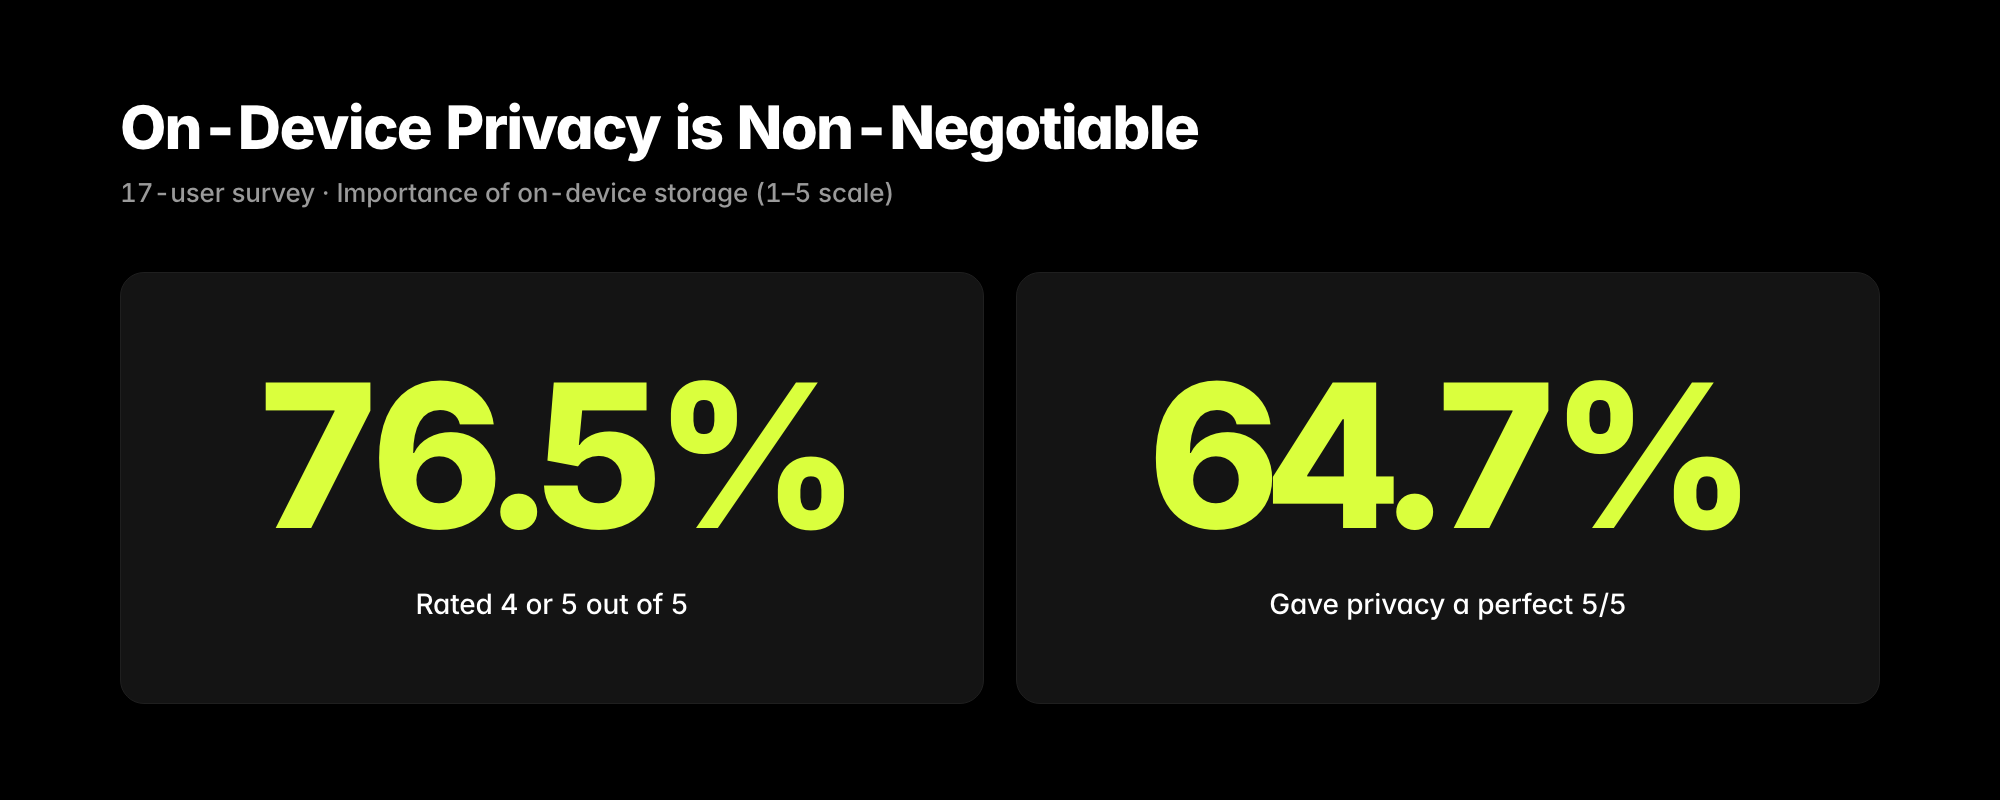
Rated on-device privacy 4 or 5 out of 5
64.7% gave it a perfect 5/5.Privacy wasn't a feature request - it was a structural requirement. That locked in the architecture: everything stored on-device, zero cloud uploads, no servers. Privacy by construction, not by promise.
Respondents picked monthly subscription
Of the four pricing options offered, monthly subscription got zero votes. Free trial first led the field at 10 votes; one-time purchase came second at 4. Because LifeFlow runs 100% offline with no recurring server cost, a one-time-purchase model is actually viable - and aligns the business model with the privacy promise.
Where the conflicts forced a choice.
Every product is the sum of its trade-offs. These three were the ones that mattered most - each one cost something real, and each one was worth it.
Phone-only storage, no cloud sync
The conflict: Storing data only on the device means users can't log in from a web browser, can't sync to a second phone, and can't recover anything if the device is lost.
The choice: I went 100% offline. I sacrificed web access and multi-device sync to guarantee absolute privacy. For a personal diary, keeping thoughts off the internet matters more than cross-device convenience.
No streaks, no badges, no gamification
The conflict: Daily streaks, badges, and social sharing are the standard playbook for keeping people in the app. Removing them costs measurable engagement.
The choice: I removed all of it. Users want a helpful tool, not a slot machine. They don't need digital trophies - they need a calm space to think and to actually see the patterns in their own behavior. Engagement isn't the goal; insight is.
Stitch together data that lives in three different places
The conflict: Tasks live in Calendar. Sleep and steps live in Apple Health. Stress and mood live nowhere. No single surface connects all three - and Apple Health itself double-counts data between Watch and iPhone, which has to be cleaned.
The choice: I built a layer that pulls all three sources together, dedupes the overlaps, and fills the missing piece through a 60-second evening check-in. The user finally sees the correlation between their sleep, work, and mood - in one place.
Three surfaces, one philosophy: do the boring work for the user.
The whole product is built around a single architectural idea - a sovereign vault. The app runs entirely offline, uses on-device APIs to silently compile the day's metrics in the background, and only asks the user to do work that genuinely requires their attention. By the time you open LifeFlow at 10pm, most of the data entry is already done.
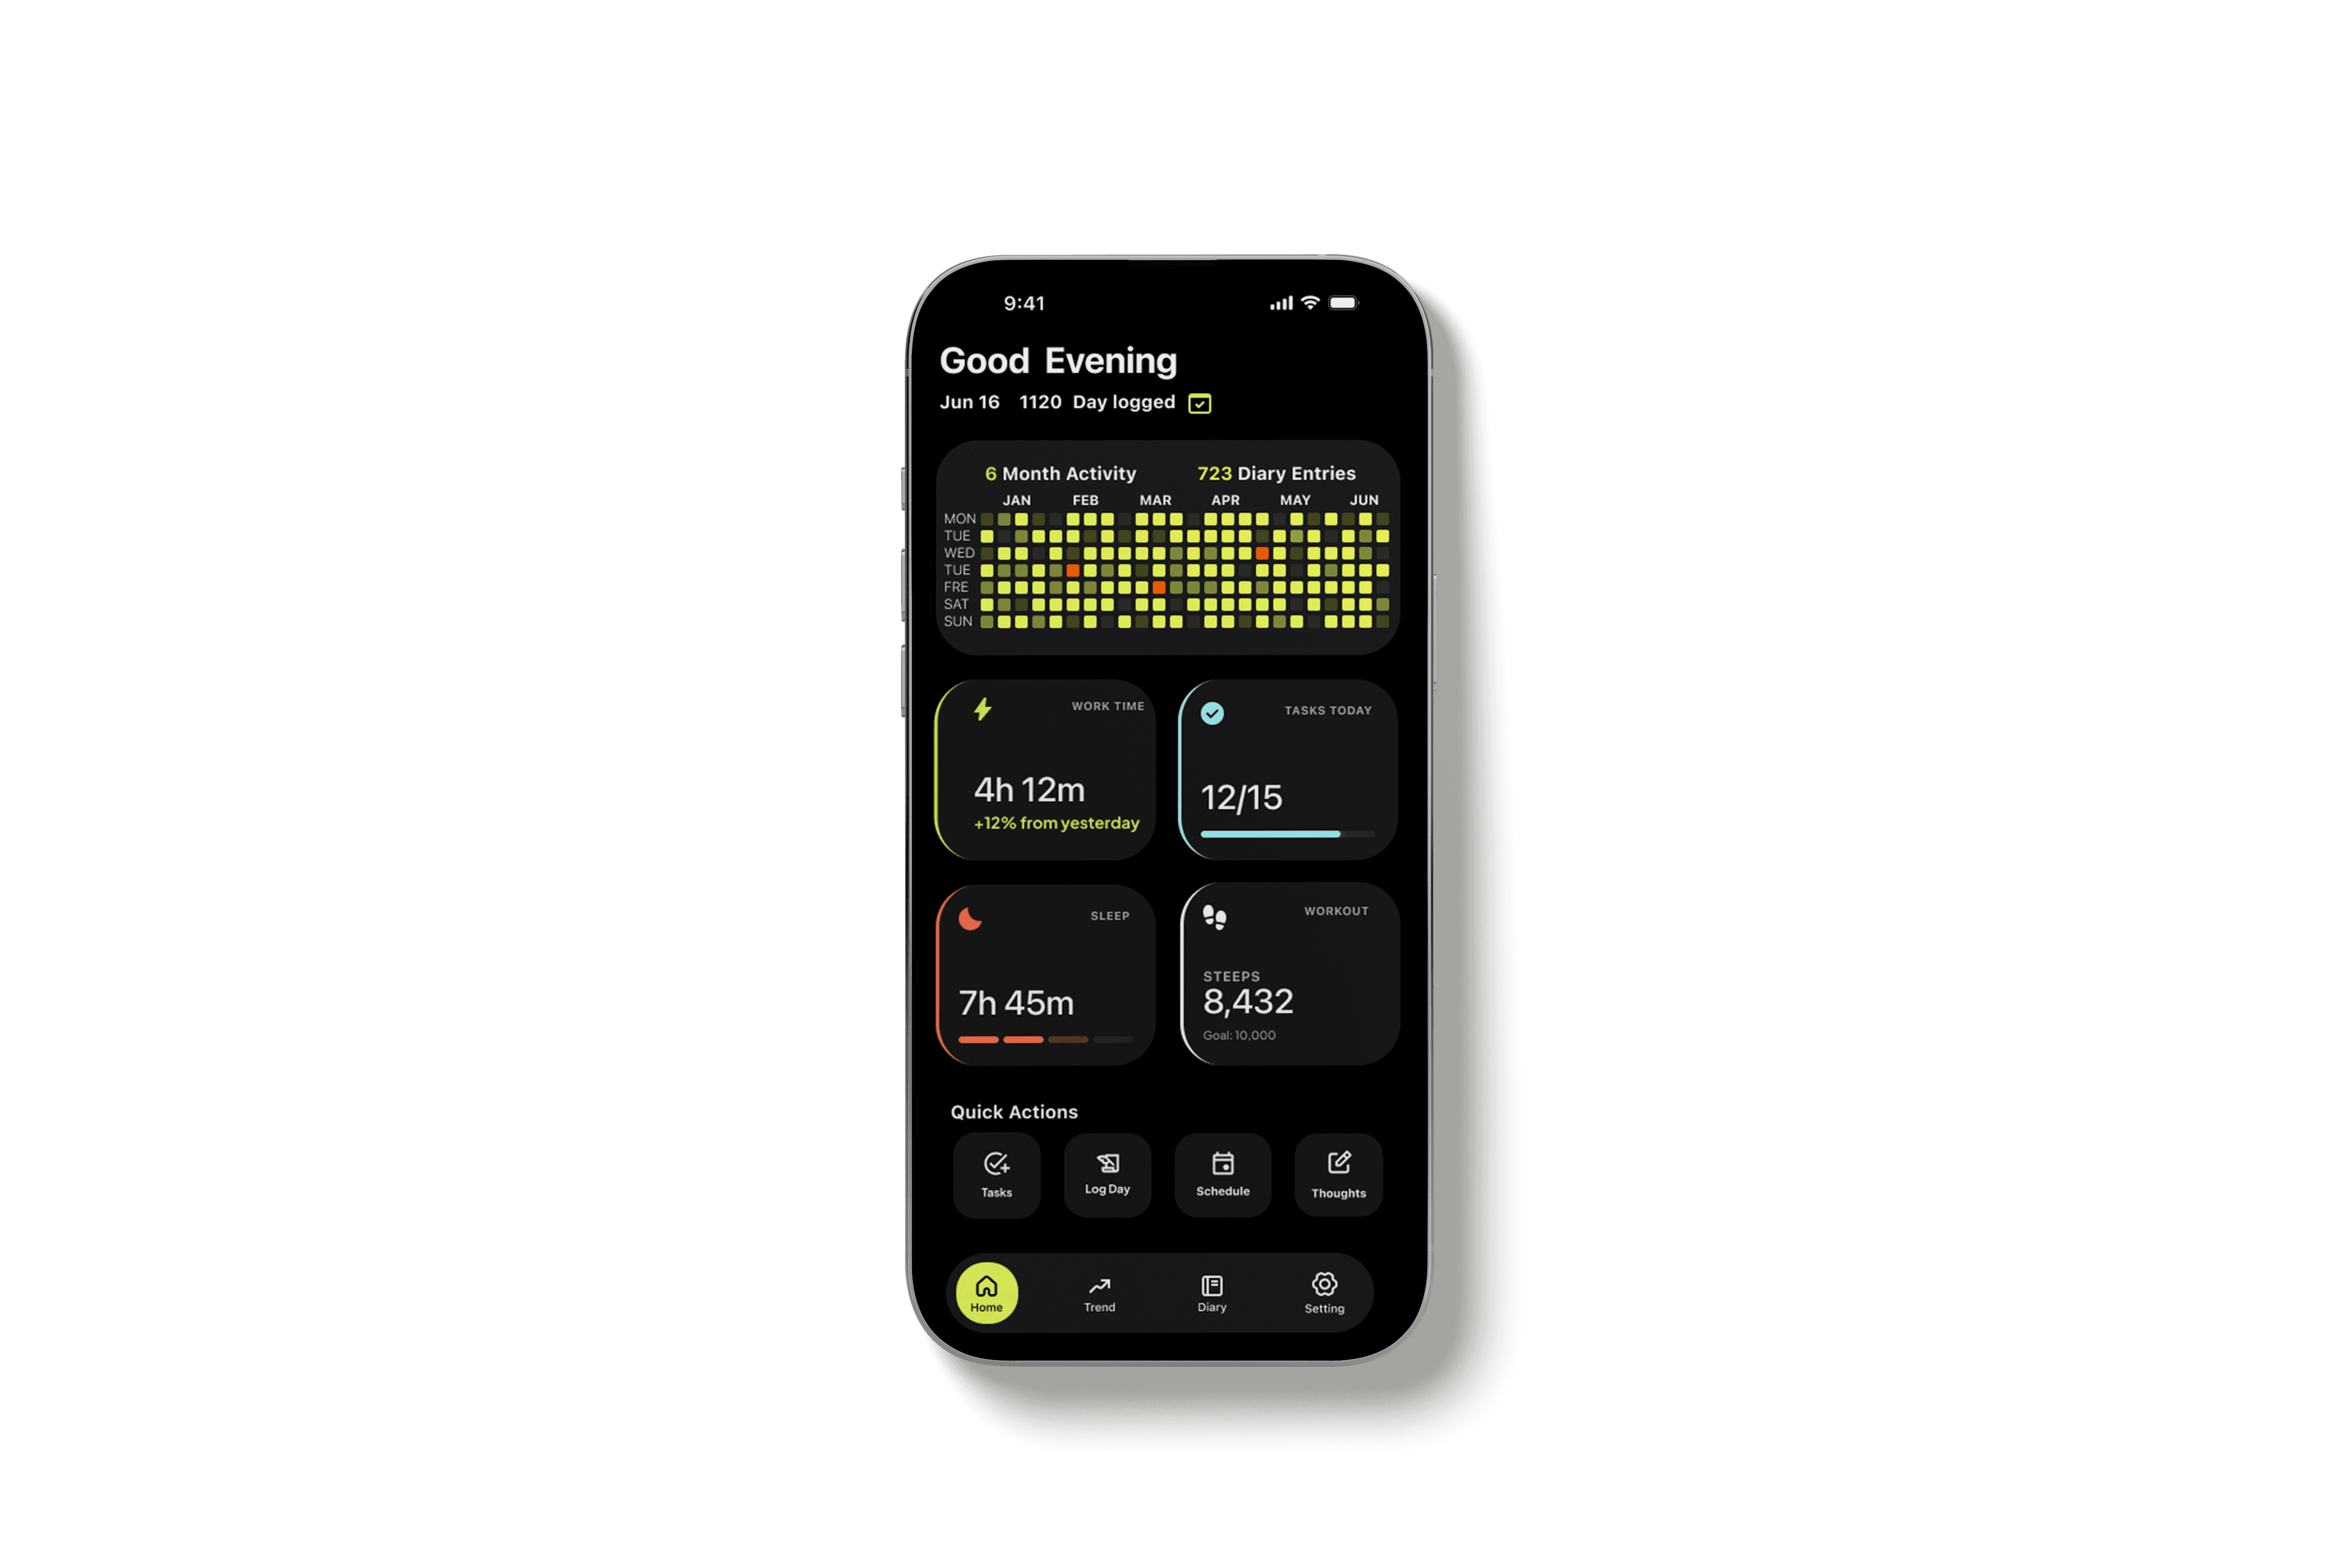
The home dashboard - a command center, not a casino
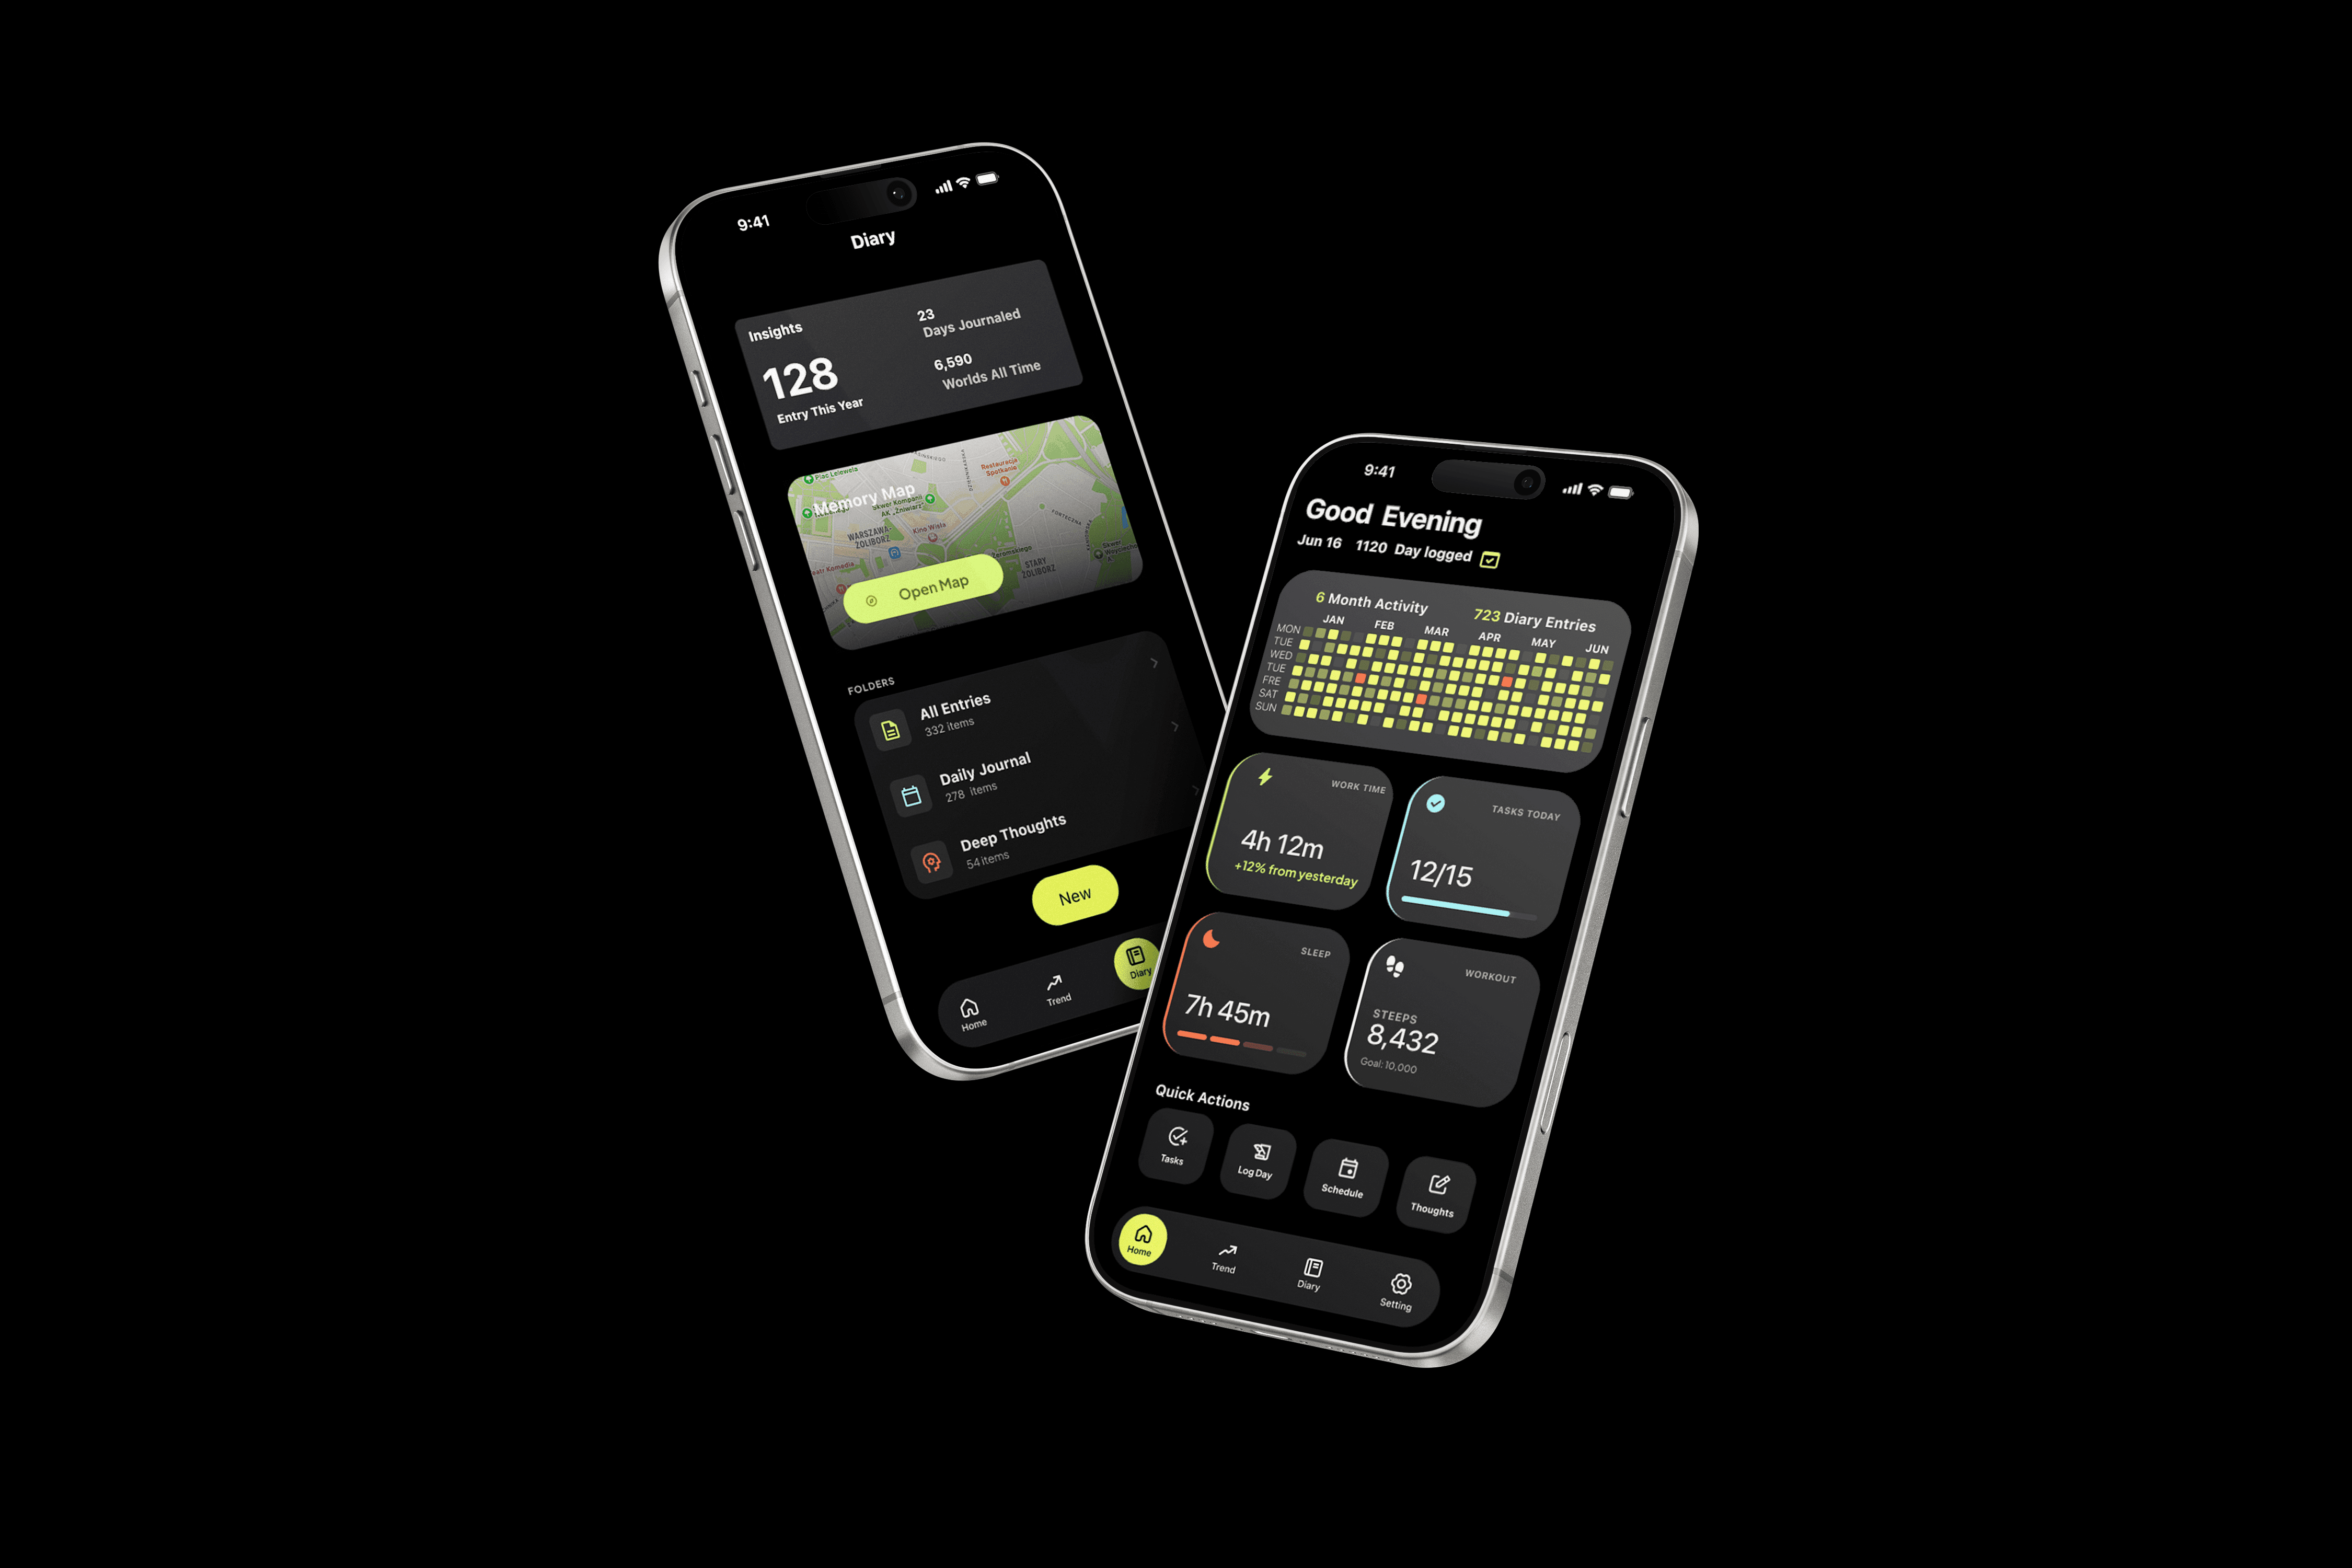
Strict native dark mode (#000000 background, #1C1C1Epanels) to reduce eye strain. The 6-month heatmap replaces the “streak” pattern - instead of a number to protect, it's an honest visualization of consistency over time. Below it, four auto-populated metric cards (Work Time, Tasks Today, Sleep, Steps) pull from HealthKit. A single neon-green accent does the work of pointing the eye at what matters; the rest of the UI gets out of the way.
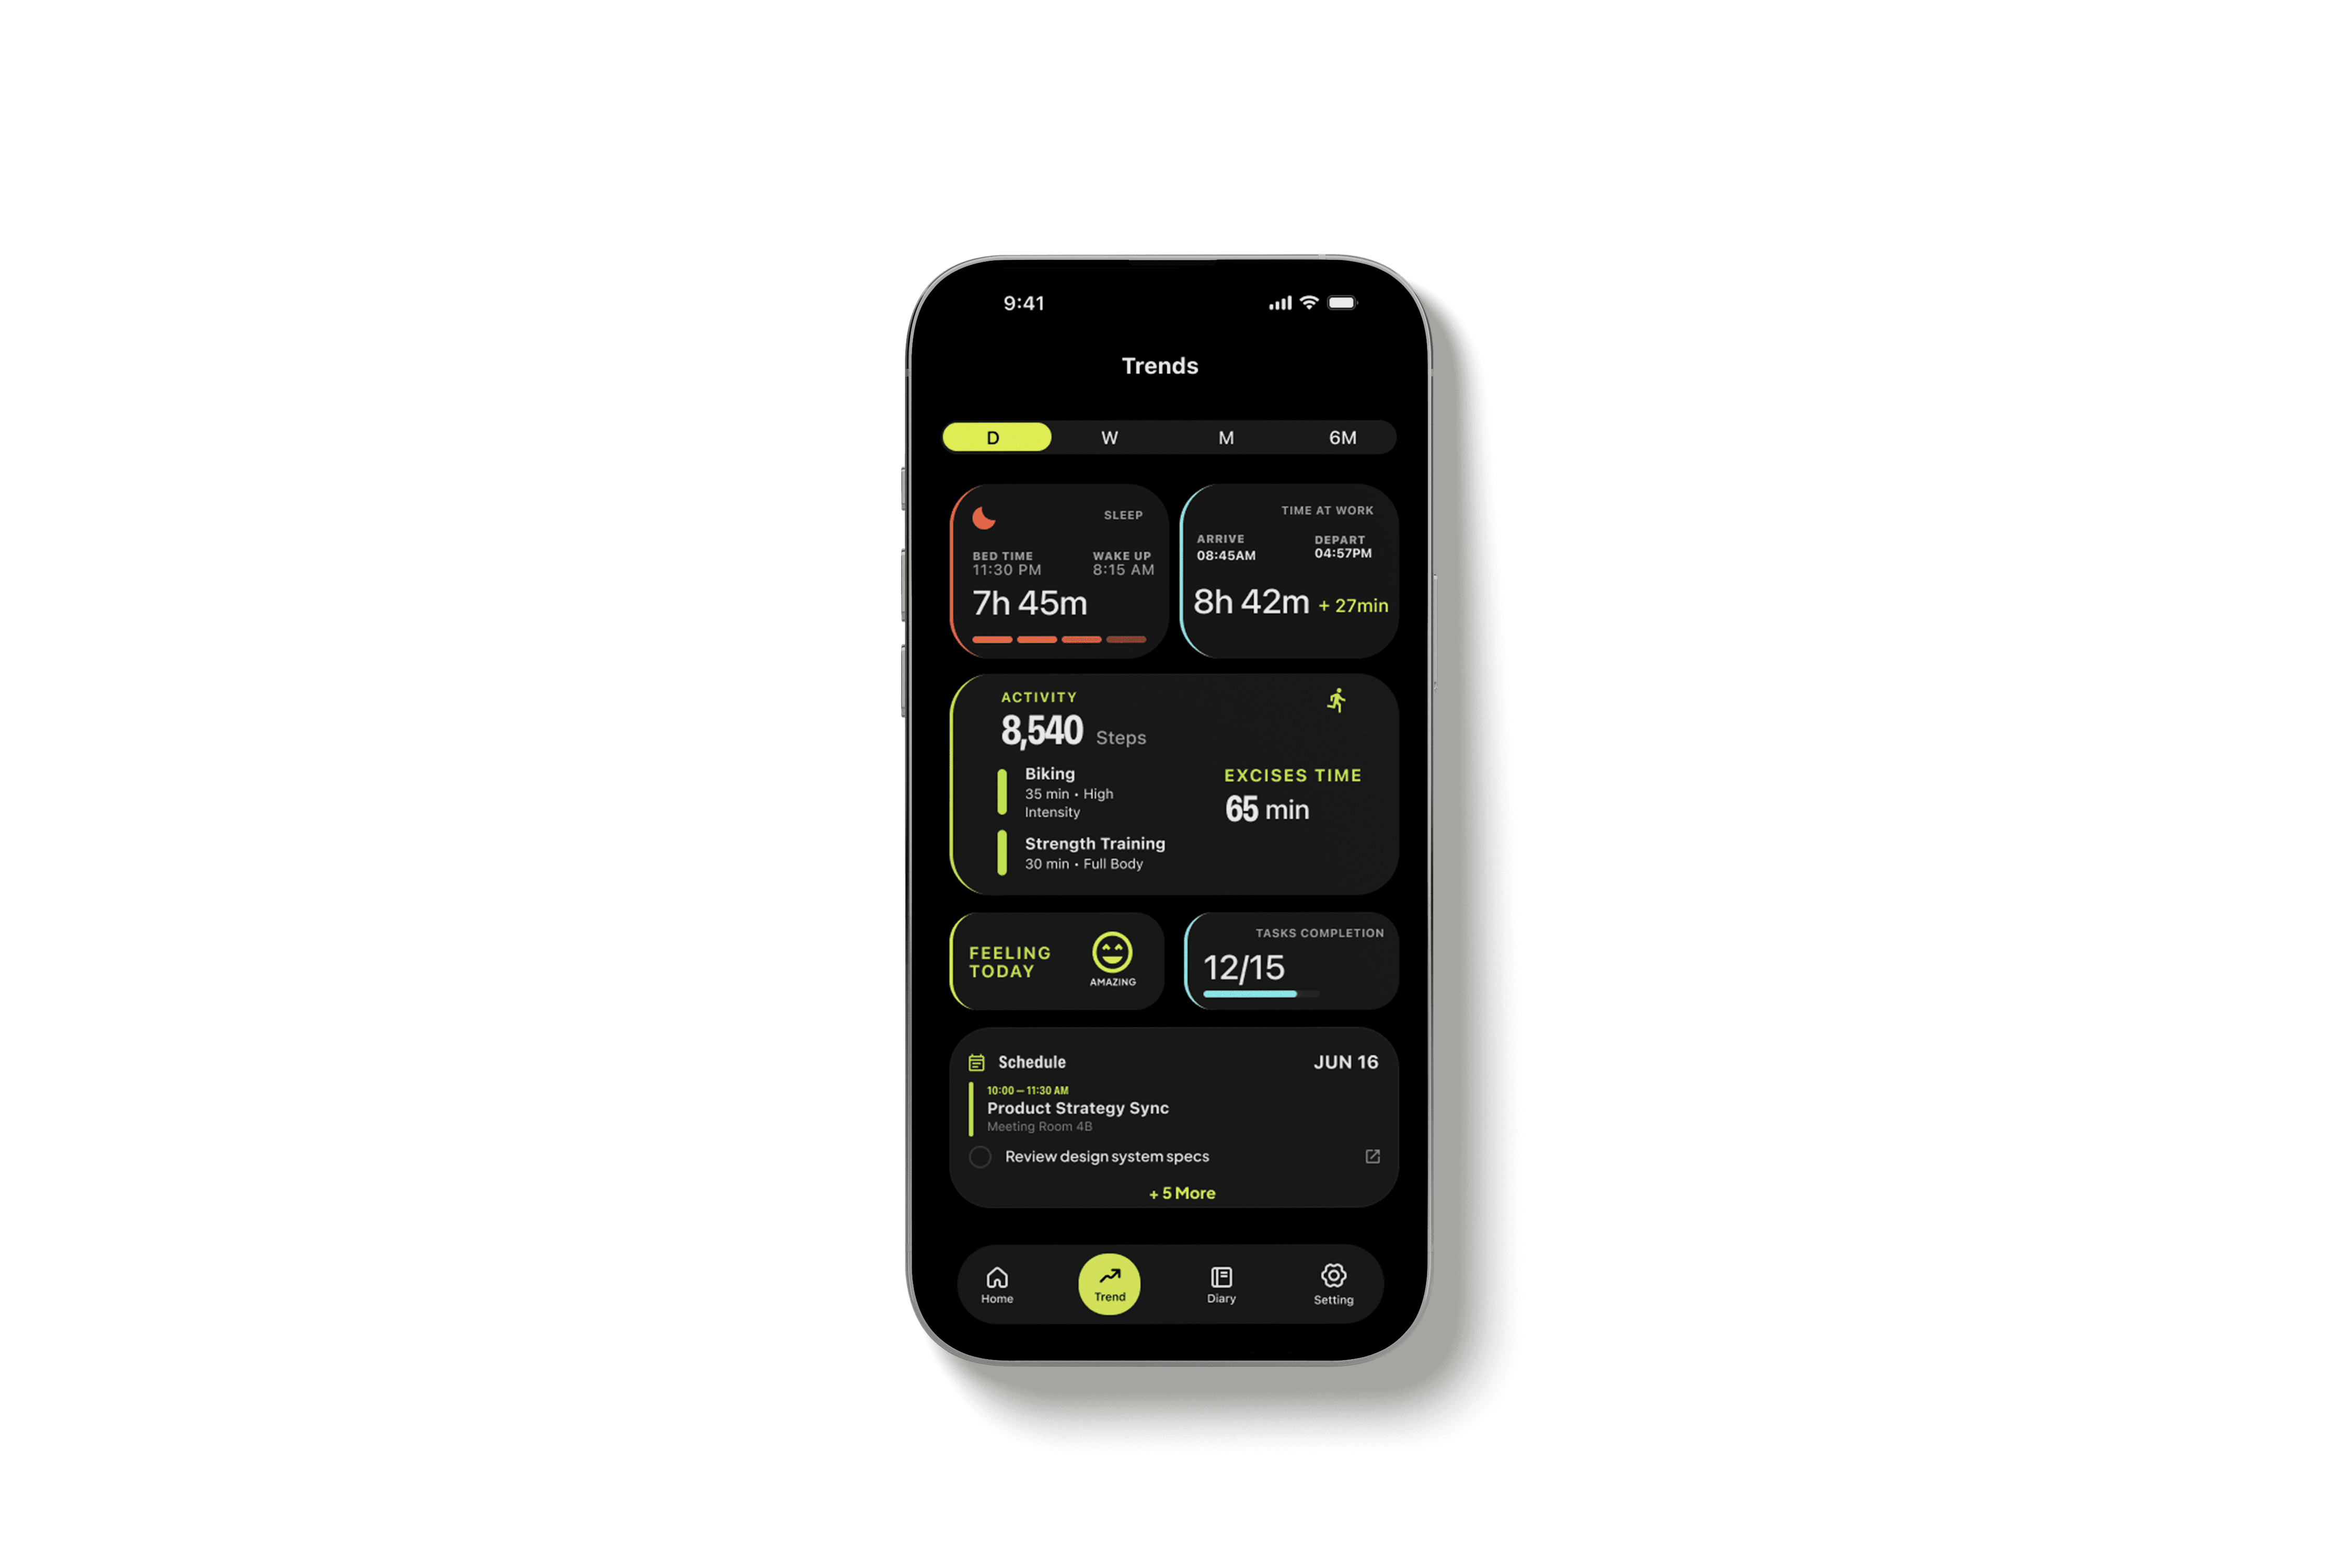
The correlation engine - data is useless without synthesis
Standard trackers show isolated data points: here's your sleep, here's your steps. The Trends page is built to help you see how those points relate. A segmented control flips between Daily, Weekly, Monthly, and 6-month views, and the chart types are deliberately different per data set so a drop in deep sleep visually lines up with the productivity dip the next afternoon. The user does the interpretation; the app surfaces the comparison.
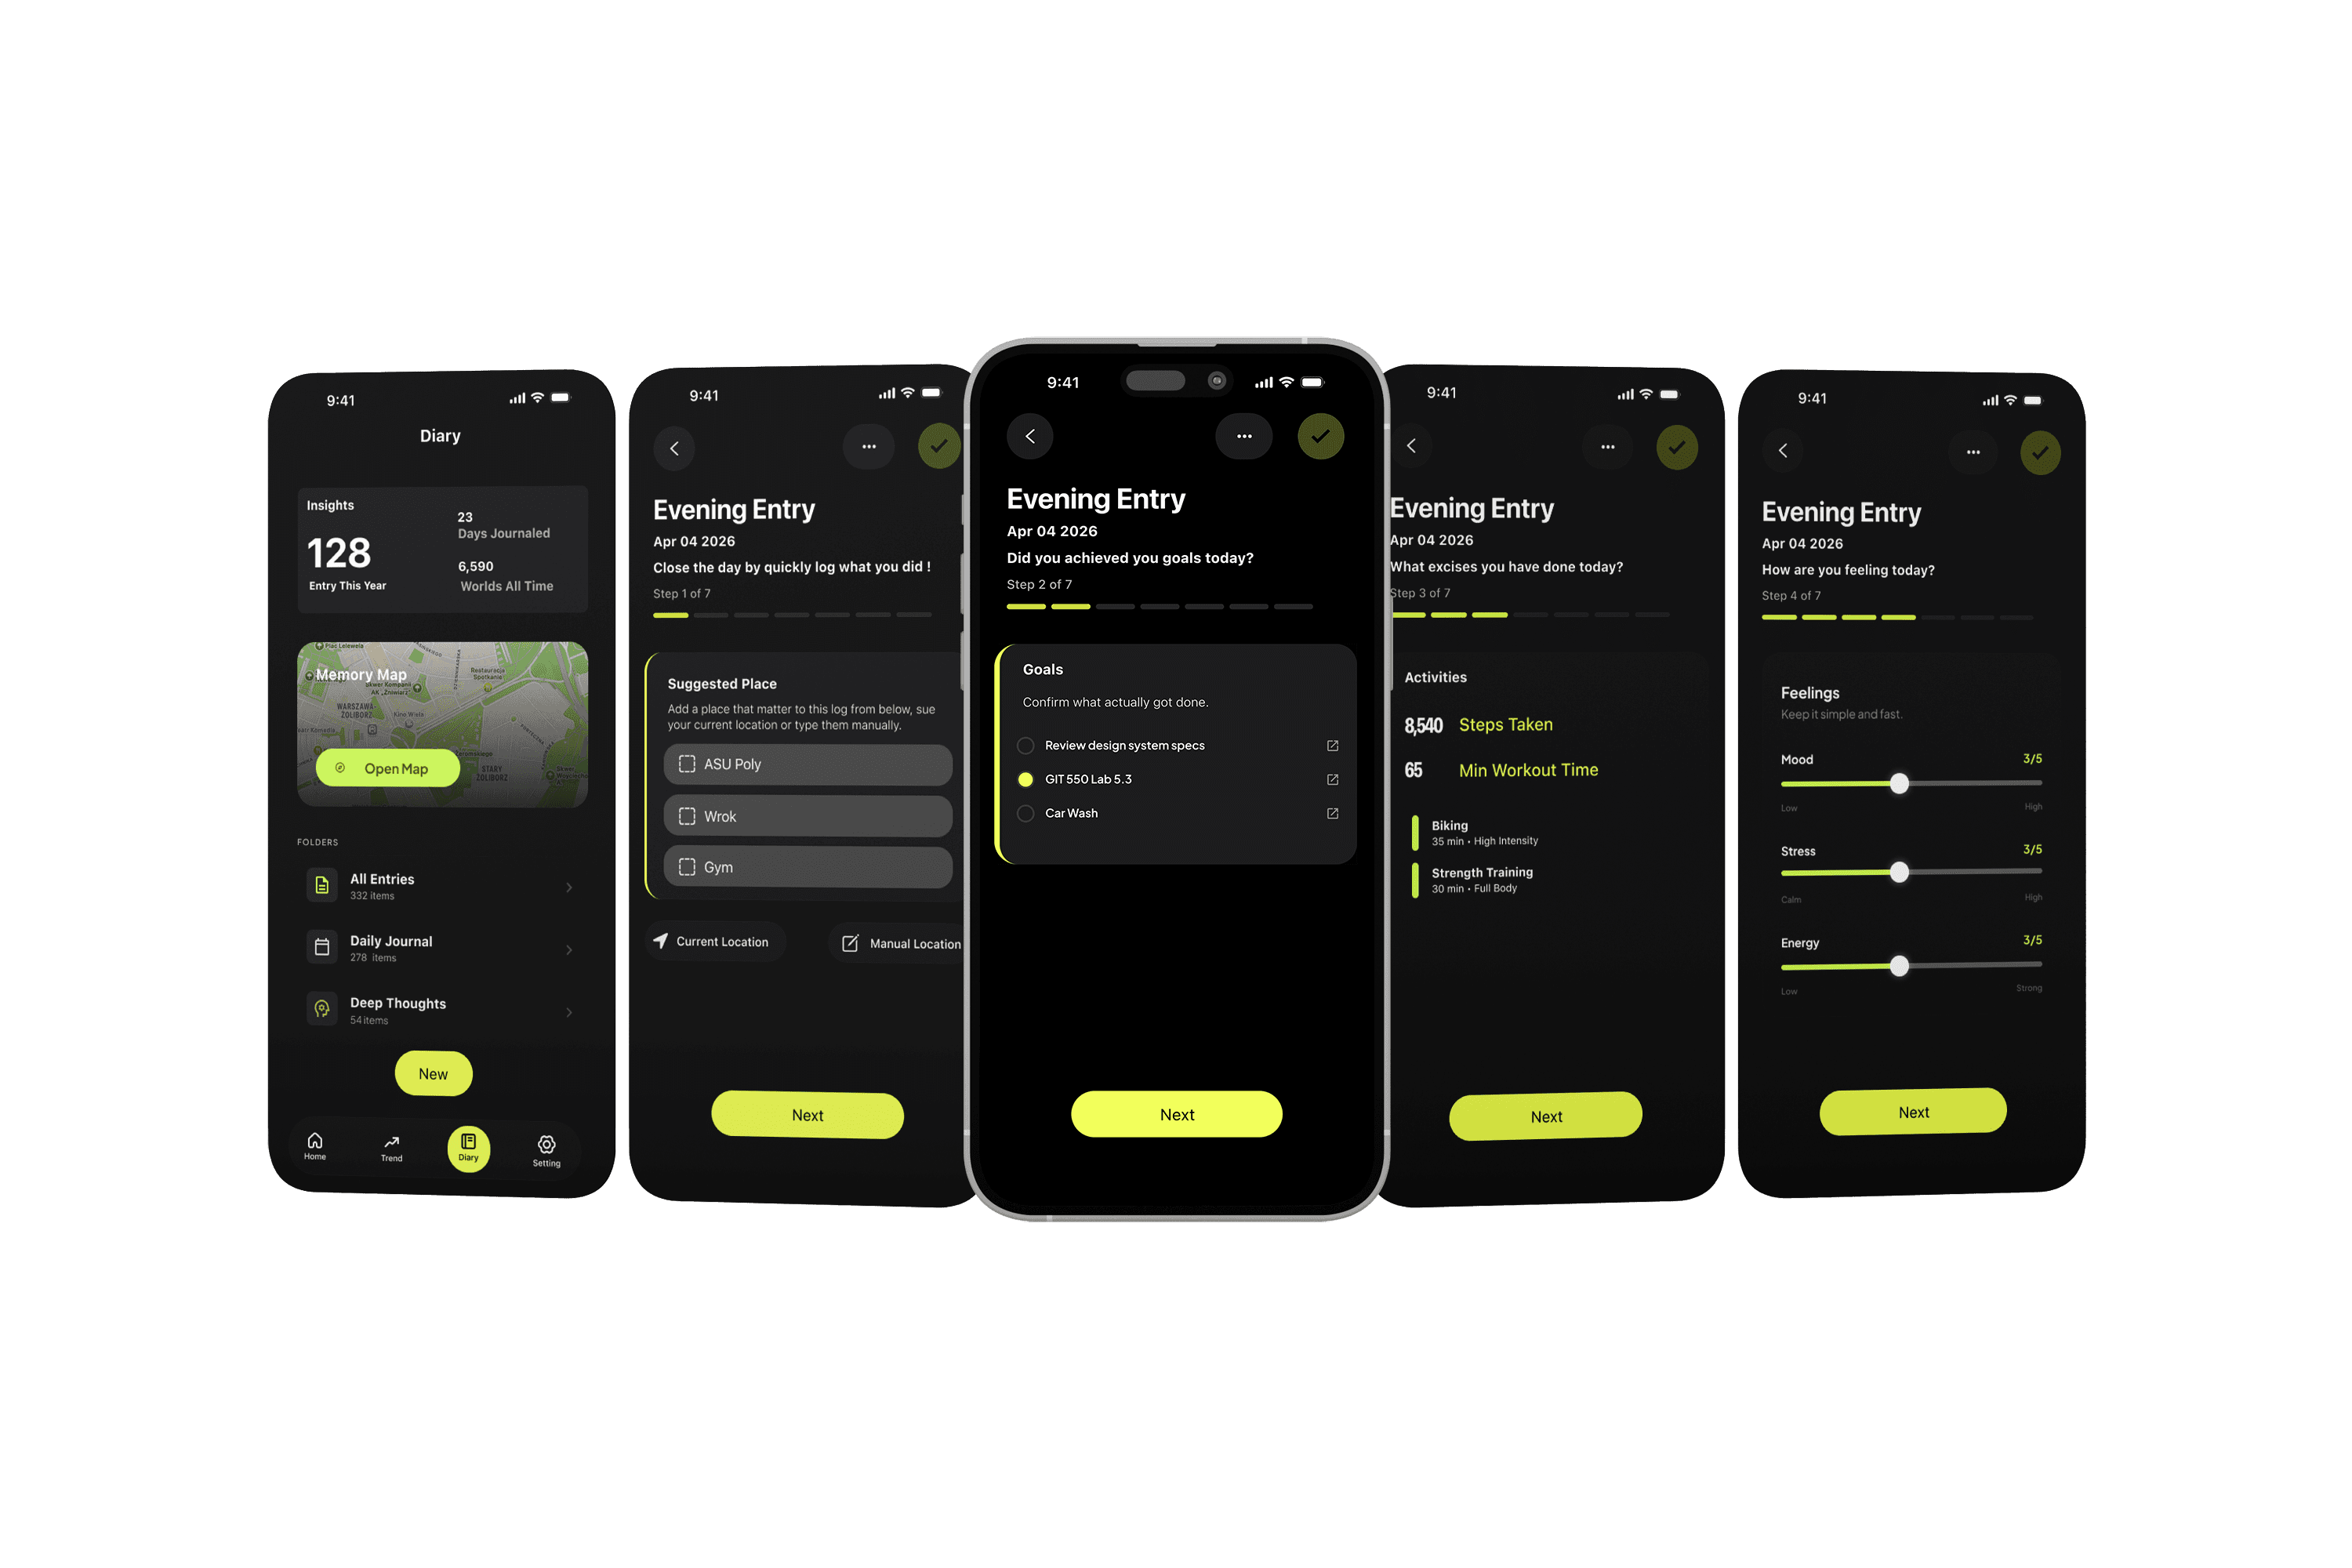
The guided debrief - eliminating blank-page syndrome
The single highest point of friction in journaling is the empty text box. When users do need to enter manual data, the cognitive load has to be near zero. The Evening Entry flow breaks logging into seven micro-steps that start with low-effort interactions - tapping a pre-filled location, confirming what got done, picking a mood from a slider - and only ease into the freeform writing once the user is already engaged with the surface.
Why a one-time purchase is the only honest pricing model here.
Standard habit trackers run as data-mining operations dressed up as wellness apps. The recurring subscription exists to justify the recurring server cost, which exists to support the data collection, which is the actual product. When I asked the 17 respondents which pricing model they'd accept, the monthly subscription got zero votes - the only option that did.
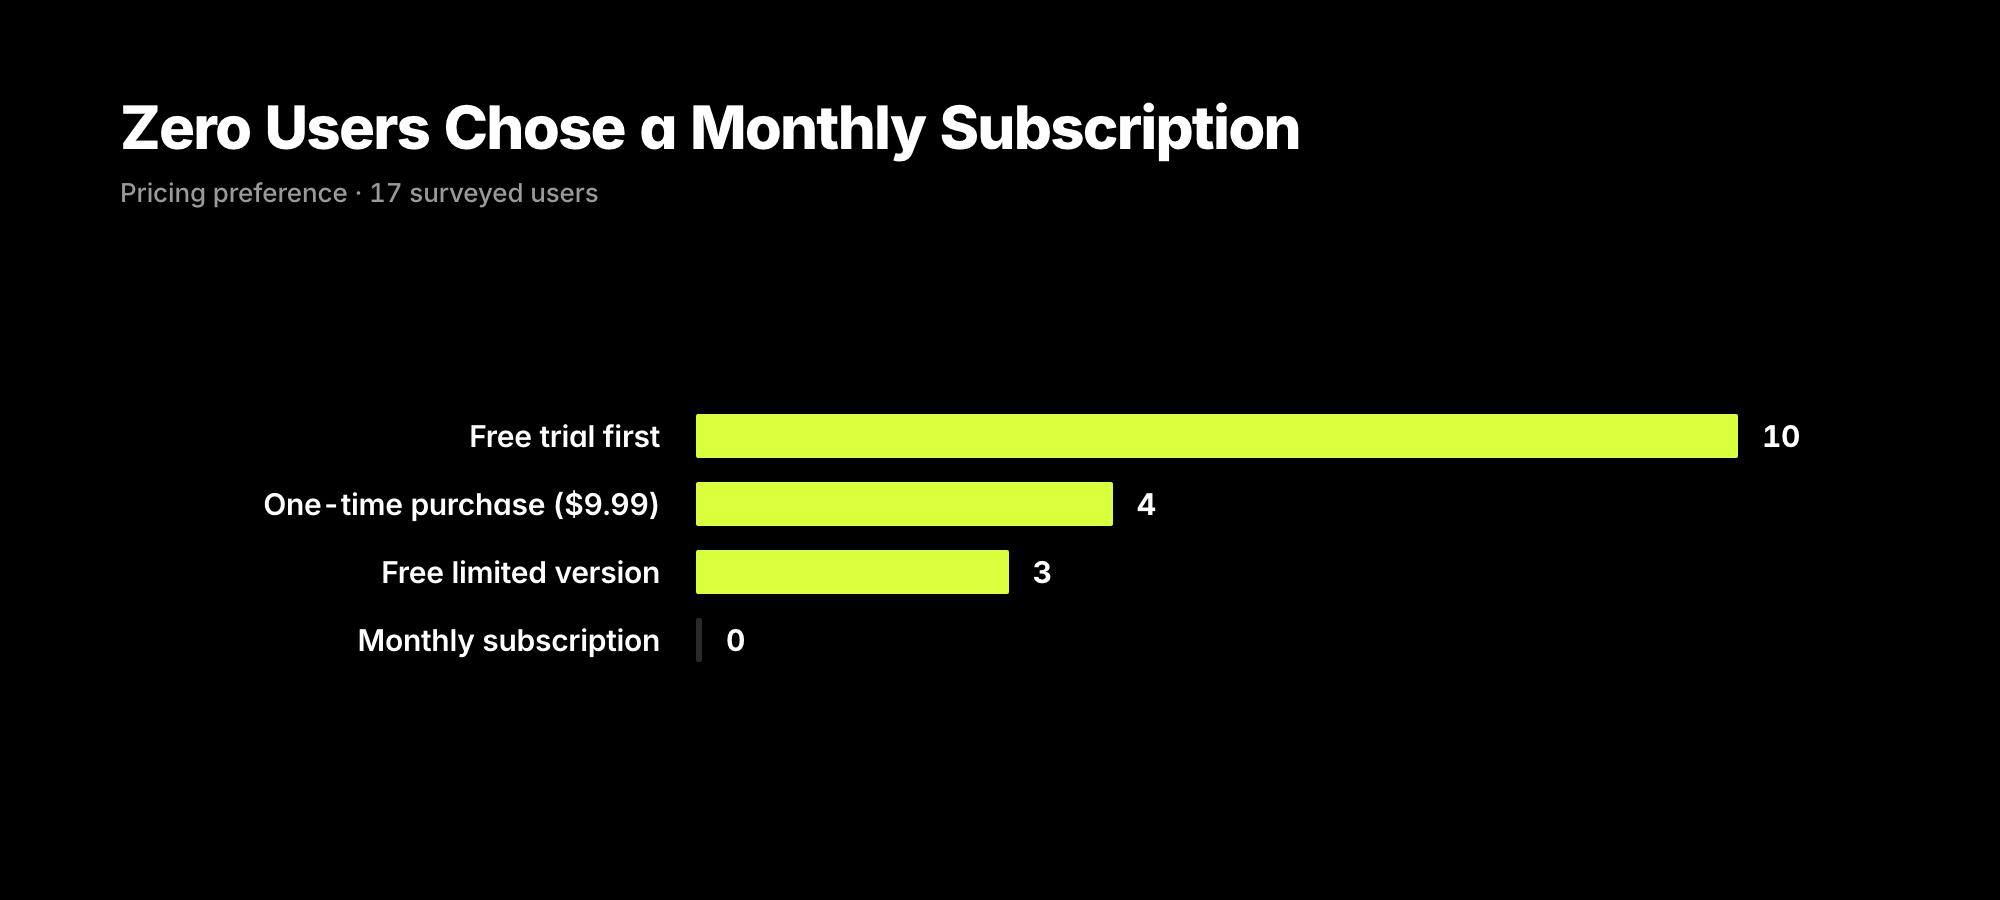
Because LifeFlow operates entirely on-device, there are no servers to pay for. No data pipeline, no auth backend, no analytics warehouse. That structural choice unlocks an honest pricing model: a single “buy it for life” purchase, optionally preceded by a free trial to satisfy the most-cited preference. The user owns the app, the data stays on their phone, and the incentives finally line up - the company has nothing to gain from siphoning information it doesn't need.
The lesson here. Pricing isn't a marketing decision; it's an architectural one. The minute you commit to recurring revenue, you commit to recurring server costs, which commits you to features that justify those costs. The decision to charge once, at the start, made every other decision easier.
From four-week prototype to shipped app.
LifeFlow is a real Xcode build - not a Figma mockup. SwiftData is wired up, HealthKit reads real metrics, and the screens you saw above render from the same SwiftUI views shown in the Xcode preview below.
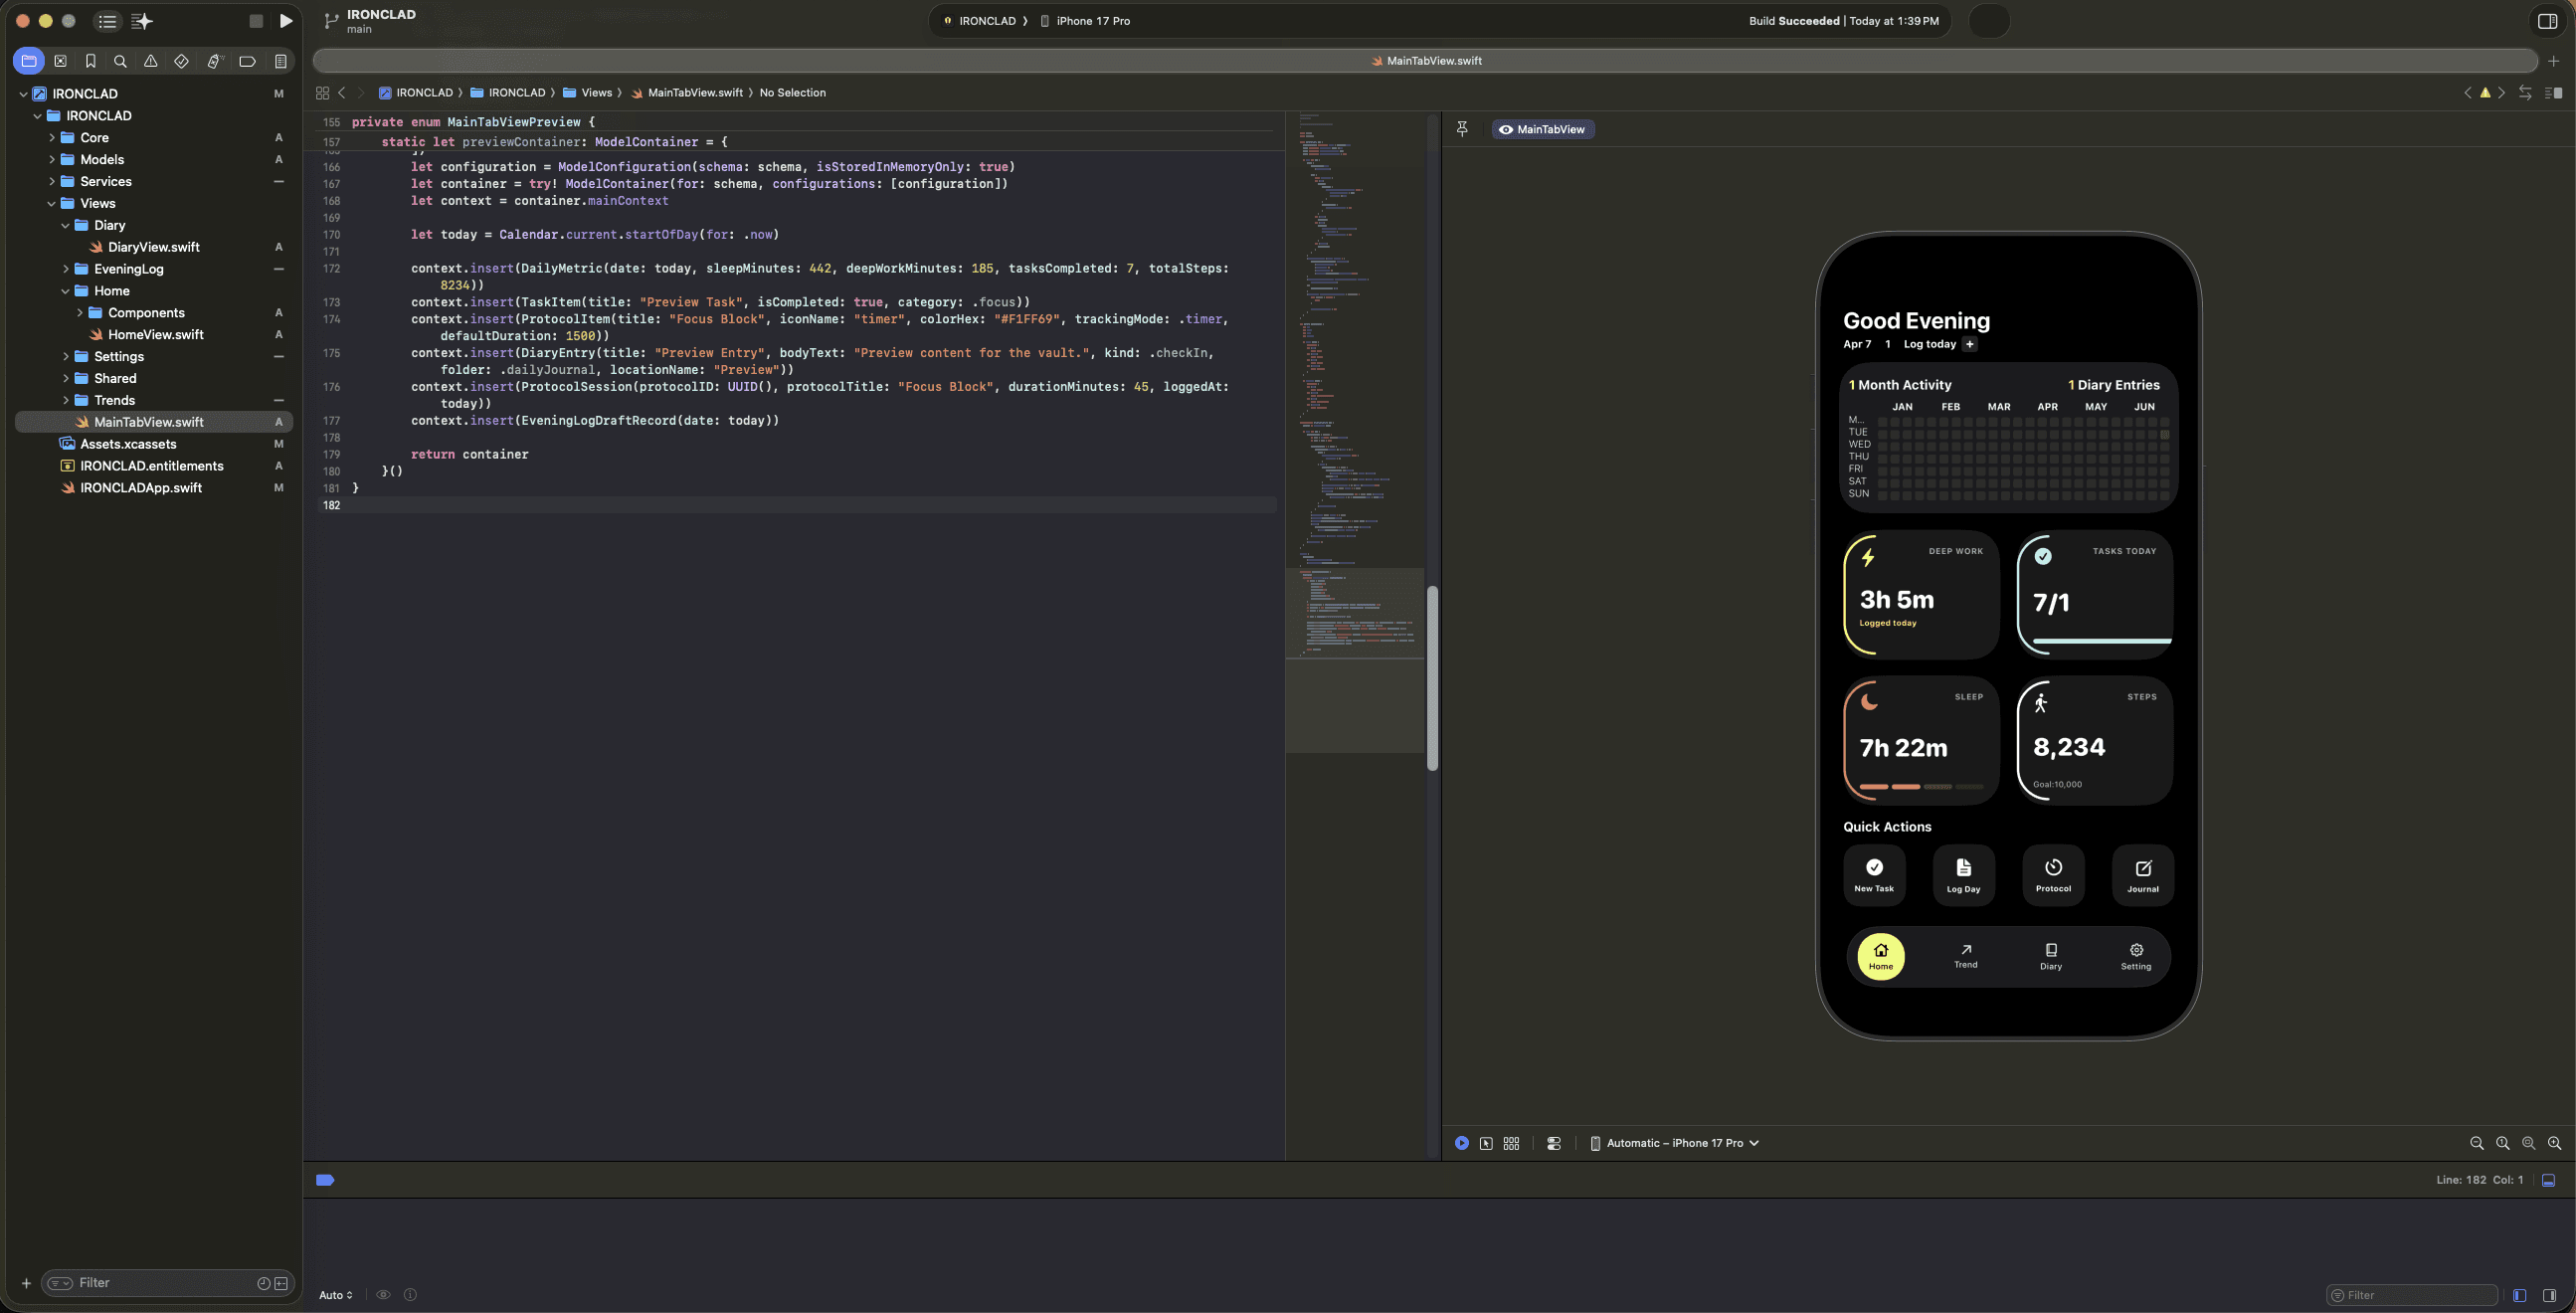
The path from here to the App Store has three concrete phases.
- Phase 1 - TestFlight beta. A closed beta with the 17 survey respondents to stress-test the HealthKit automation and the correlation engine on real-world data. The people who described the problem get to break the solution.
- Phase 2 - App Store v1.0. A public launch of the sovereign vault, with the 6-month heatmap, automated metric cards, and guided debrief. One-time purchase, optional free trial, no subscription tier, no upsell.
- Phase 3 - iOS ecosystem integration. Home Screen and Lock Screen widgets so users can glance at their numbers without opening the app. The fewer reasons to enter the app, the more honest the data is.
The biggest lesson from this project: intentional constraint is a design tool, not a limitation. Forcing the app to be 100% offline forced me to be disciplined about information architecture in a way I would have skipped if cloud sync were on the table. Every screen had to serve the immediate, local needs of the user - because there was no “sync later” to fall back on.